|
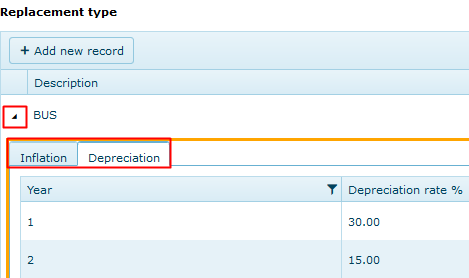
"Replacement Types" must categorise vehicles with common:
•Annual Depreciation rates (i.e. decrease is disposal values)
•Annual Inflation rates (i.e. increase in replacement cost)
Create as many Replacement Types as you require given the nature of your fleet.
Examples:
A.A fleet with only cars may only require two or three types to cover different depreciation/inflation rates e.g. one each for standard, luxury and electric vehicles.
B.A diverse fleet with plant, equipment, commercials and light fleet may require several Replacement Types to reflect the different depreciation/inflation schedules of each item type.
How depreciation and inflation rates are applied
Annual depreciation and inflation rates are applied to previous years result.
Example:
Purchase price =$10,000
Year 1 depreciation = 20%. Result: $10000 - 20%= $8000
Year 2 depreciation = 10%. Result: $8000 - 10% = $7200
Year 3 depreciation = 10%. Result: $7200 - 10% = $6480
Inflation is applied in the same way.
Annual depreciation and inflation rates are applied from the purchase date of the item.
Example:
If an item was purchased in 2012 and the forecast starts in 2014, the replacement cost at the start of the forecast has already been inflated for 2 years using the inflation %'s for years 1 and 2.
"Number of Rate Years"
This figure is fixed at 20, which is the maximum forecast term.
Shorter forecast periods can be set when generating forecasts in the module.
|
Inflation/Depreciation Tabs

Note:
When entering %'s for each year, even for long term forecasts, only the number of years relating to the maximum expected life of assets is required.
E.g. for 10 year forecasts, if the life of assets is never more than 5 years, then the %'s for years 1-5 are applied twice to cover the 10 year period, so only %'s for years 1-5 are required.
It is worthwhile adding some extra years in case assets life cycle extends beyond the norm.
|
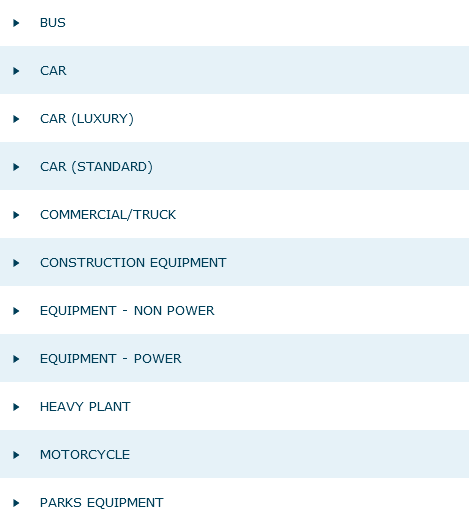
Examples of Replacement Type Categories

|